


Meandering Tour
Special Finance Edition | Disclaimer: Past writing results do not guarantee enjoyment of this week's column. Subscribers should carefully consider their reading objectives and tolerance for inanity.


5) A Pitiful Walk Down Wall Street
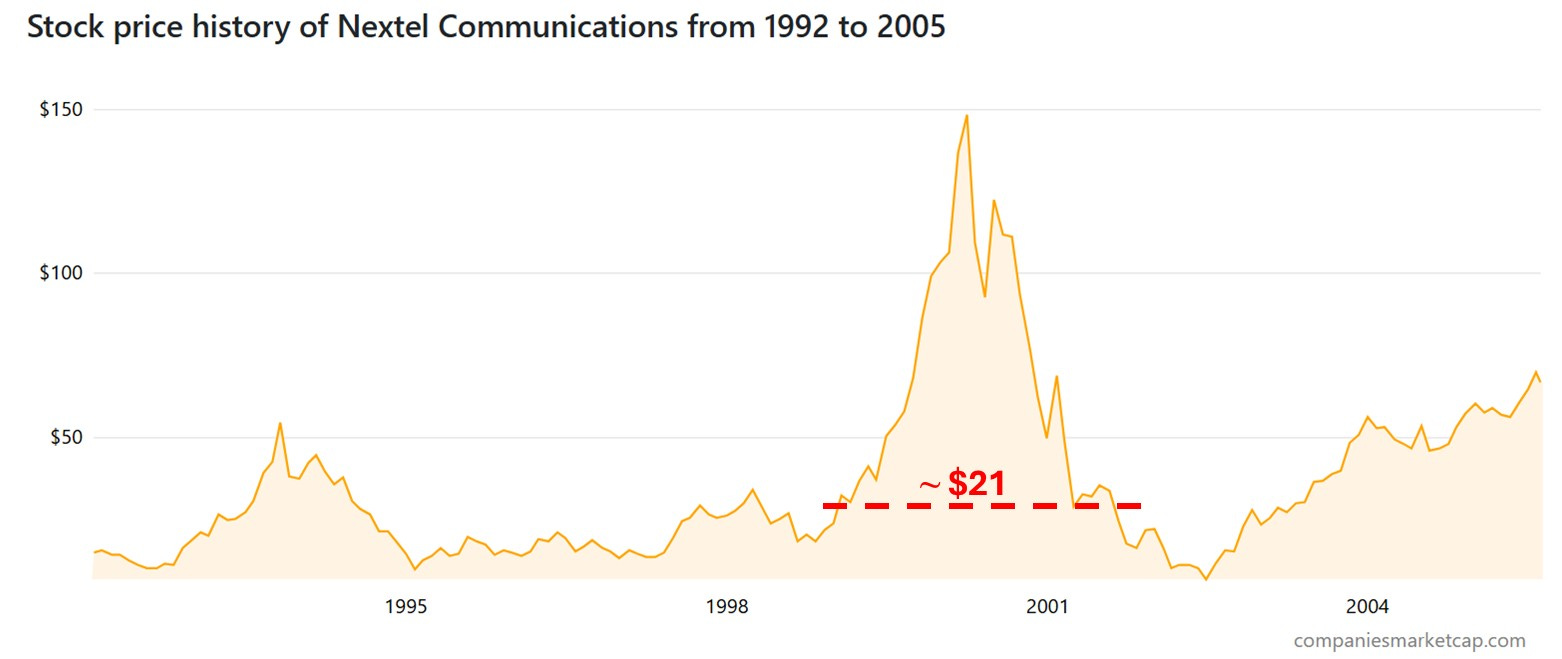
In November 1998, my friend Carl suggested I consider investing in Nextel Communications, the pioneering wireless telecommunications company. I had previously invested only in mutual funds, in my 401(k) plan, and embarrassingly had no experience buying individual securities. The stock market was in the midst of a telecom boom as part of the broader dot-com frenzy, so I booted up and purchased 50 shares of NXTL at about $21 a share.
Over the next 16 months, I watched ecstatically as the stock soared close to $150, a 600% increase in my savvy investment. In March 2000, I called Carl and told him I was ready to buy another stock. “Hold on,” he said. “The market’s getting pretty frothy. Why don’t you consider trimming half your position in Nextel and lock in some gains.”
No way, I insisted.
What happened next to Nextel? The stock plunged as the dot-com bubble burst, and tech stocks began their long, sharp decline. But I was not to be deterred because, well, I knew nothing. I held on to my 20 shares, confident that my first stock investment would turn around, until in September 2021, I finally sold my shares at . . . $21, my original purchase price.
And so began the Sherman Tax-Efficient Equity Fund, a strategy designed to optimize wealth management by minimizing taxes on investment returns.
Coincidentally, just as the NASDAQ was imploding in March 2000, along with my cherished Nextel investment, I was about to be employed by a global asset management company, famed for its long-term growth stock investing.
I can explain.
4) “Career from Career to Career”1
“You can be a millionaire and never pay taxes,” Steve Martin deadpanned in his January 1978 Saturday Night Live monologue. “You say, ‘Steve, how can I be a millionaire and never pay taxes?’ First, get a million dollars.”
Tax optimization aside, Martin had a foundational insight, which could be translated as follows: unless you’re independently wealthy, financial planning requires career planning. So, first, get a job.
Two weeks ago, the Federal Reserve Bank of New York released data on unemployment rates for recent college graduates, ages 22 to 27. The bank found that in 2023, graduates in art history and philosophy had unemployment rates (3% and 3.2%, respectively) lower than those who had majored in computer science (6.1%), computer engineering (7.5%), chemistry (6%), and physics (6%). Think still life and stained glass, not STEM.
The Fed naturally reported much higher compensation in the technical fields, and such employment trends are cyclical. Still, you never know where meandering will take you.
I began my professional career as a lawyer, quit the law after seven years, worked as a magazine editor, did some business consulting, then found a position in academic medicine involving biomedical research commercialization, and finally landed at the aforementioned financial services company.
Friends and family kindly pointed out that, other than the practice of law, I lacked the qualifications for these positions. My job in finance especially amused Carl, who had advised me to buy Nextel at a low price and to sell at its peak, and others who knew of my poor math skills.
But two of my strengths are strategic planning and business development, common threads in my non-legal jobs. (Read: I had nothing to do with stock-picking at the company.) I’m also a strong believer in the transferability of core competencies among different types of jobs, something I emphasize to young people who are thinking about pivoting to a new career. And finally, my boss adopted the “Sherman Arithmetic Rule,” which required colleagues to double-check the figures in the charts, graphs, and financial projections in my strategy decks. That rule was eventually extended even to page numbers.

3) Ticker Symbols
Day 1 at the company went reasonably well as I was introduced to colleagues. Their terminals were flashing green that day, which I thought was probably good news. Somebody patiently explained to me that “bps” stands for “basis points.”2 I actually had some experience with Excel in my previous job, for which I was unqualified. And I kept the NXTL story to myself.
The next 18 years were immensely rewarding thanks to my interesting responsibilities and my colleagues’ intellect and character. I worked on distribution strategy in the U.S. and abroad, large organizational design projects, the development of new products such as active ETFs, and business deals in countries such as India and China.
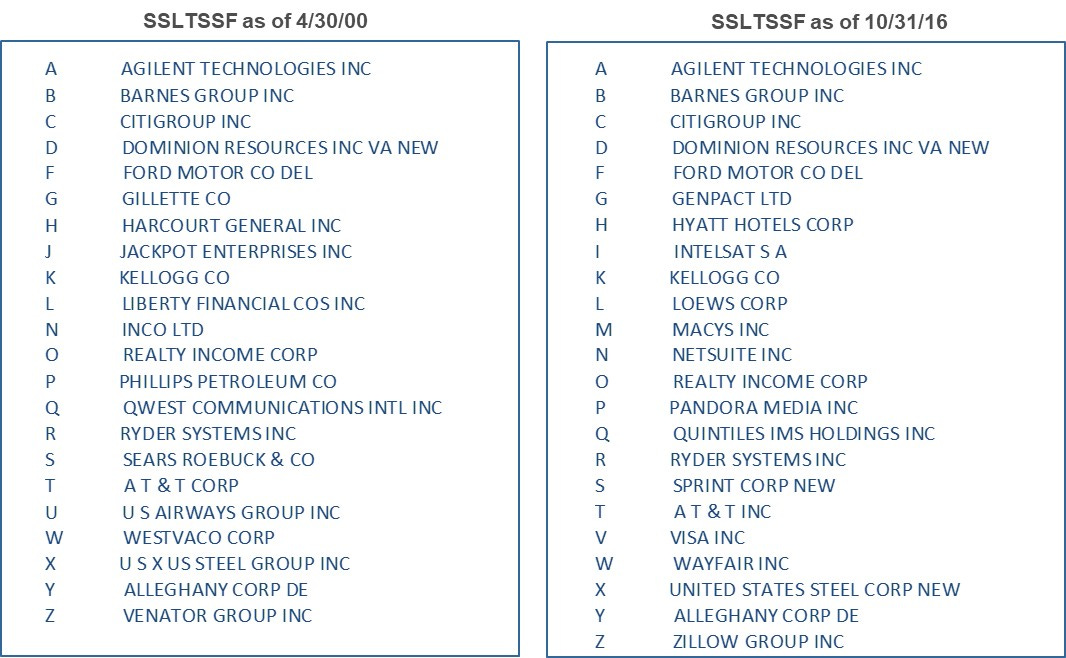
One day, early in my tenure, I (sort of) jokingly asked a portfolio manager (PM), what would happen if he were to create a portfolio consisting only of stocks with one-letter ticker symbols? There were 22 at the time,3 including Citigroup (C), Ford (F), and Kellogg (K)? My investment thesis: reputable, longstanding companies with blue-chip characteristics, deep resources, strong brand recognition, and memorable ticker symbols could translate into long-term over-performance.
The PM, a consummate gentleman and scholar, chuckled nervously, a small vein visibly pulsing in his neck. Unfailingly polite, he quietly said, “That’s funny.”
Undeterred, I decided to test my theory by setting up a mock Yahoo stock portfolio, one of the few ways for a layperson to track a stock model in the early days of the Internet. My model actually did reasonably well compared to the overall market, which I reported to the ever-tolerant PM from time to time. Then, I just stopped following it.
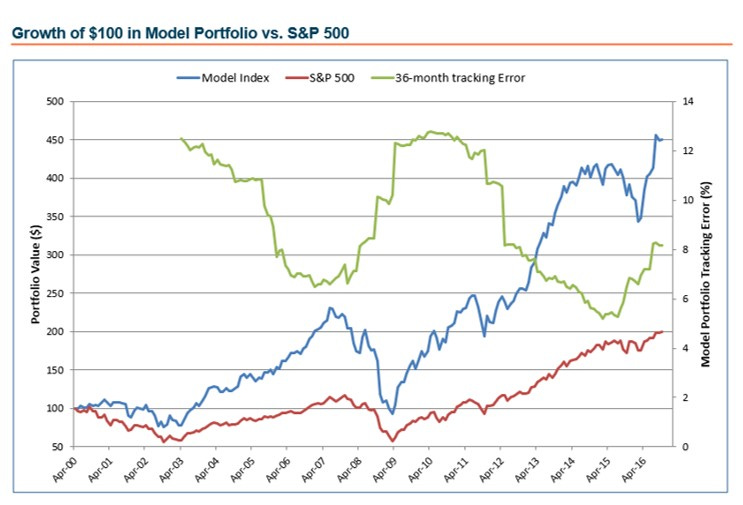
Many years later, when the PM was about to retire, I asked the head of our quantitative equity group to compare the returns of my model to the S&P 500 from 2000 to 2016. (If you’re still awake and interested, the portfolio construction details can be found in this footnote.)
I presented the long-suffering PM with a bound report on the now-infamous Sherman Single Letter Ticker Symbol Stock Fund (SSLTSSF). Among the findings:
SSLTSSF experienced higher compounded annual growth than the S&P 500 (9.22% vs. 4.13%).
Compounding resulted in 4.5 times an initial investment in my fanciful model vs. only doubling in the S&P.4
Even a blind squirrel . . . .
2) Do It Yourself
So, you’d like to try something like this yourself but don’t have access to a world-class quant team.
Don’t worry. Now there’s Generated Assets, an AI platform whose slogan is, “Turn any idea into an investable index.” Launched just over two weeks ago (h/t JC), GA automatically back-tests the resulting portfolio over periods of up to 10 years and provides metrics such as returns, diversification, and risk.
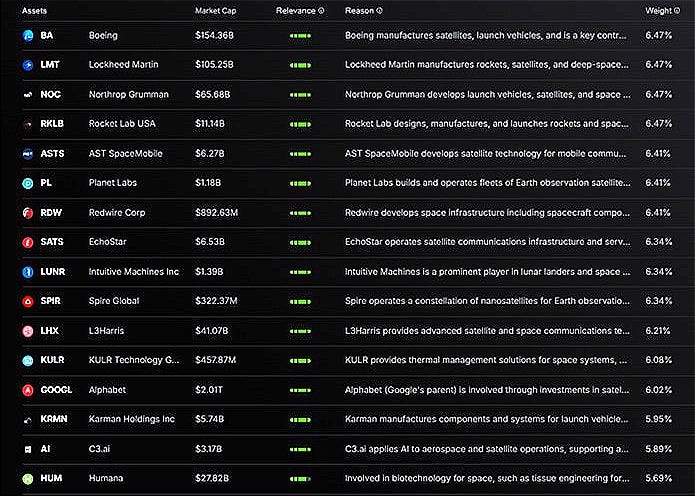
I entered the term “space travel, and, in seconds, GA created “Cosmic Voyagers (CV).” The model consists of launch vehicle manufacturers, component suppliers, and satellite technology companies, with a mix of established aerospace giants and newer entrants in the commercial space race. Since 2015, its total return would have been 190% vs. the S&P’s 150%. But over the previous five years, the S&P would have bested CV, 73% to 41%.
Remember the old warning, though: past performance is no guarantee of future results. Still, GA offers a way for self-directed investors to experiment, without paying a financial advisor.
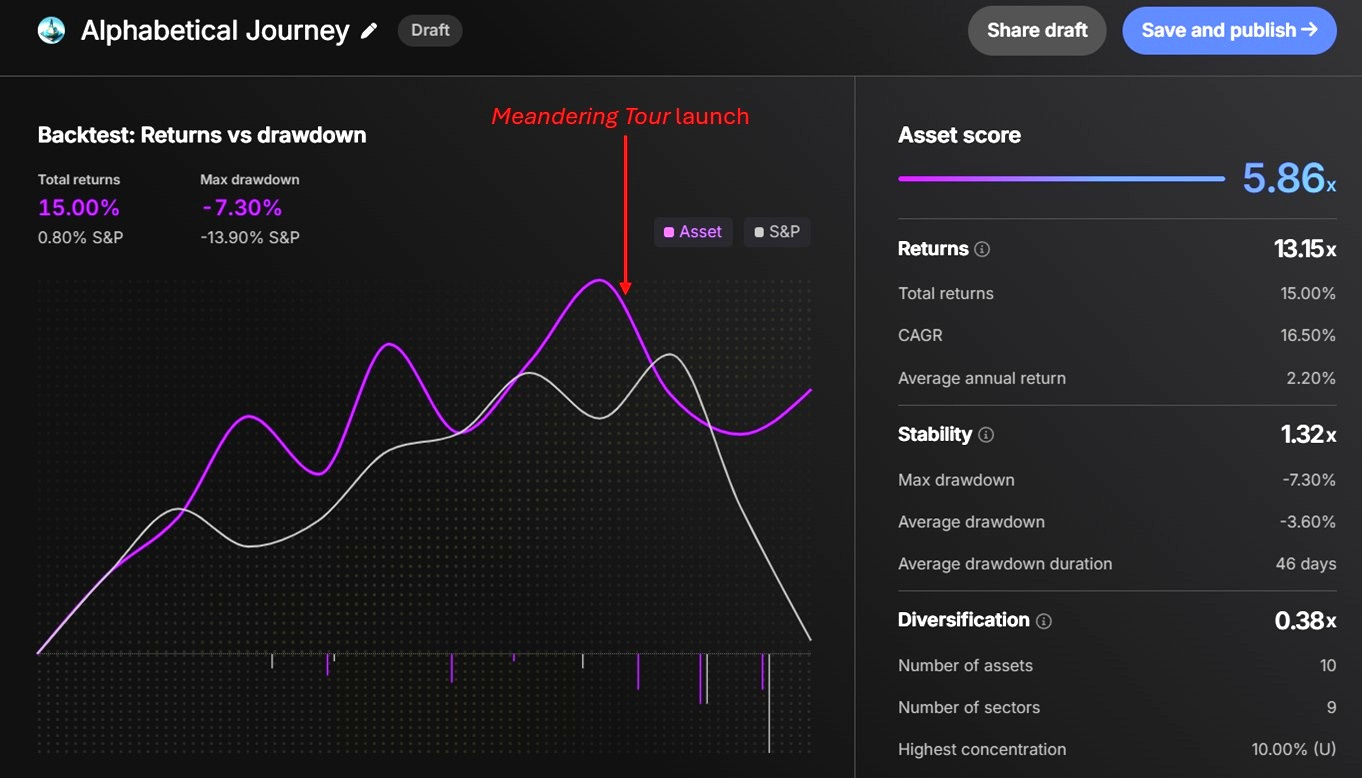
As you might have predicted, I asked GA to “create a portfolio consisting of stocks whose ticker symbols are M E A N D E R I N G T O U R.” The response was the following model, which GA named “Alphabetical Journey.”
M: Macy's (retail)
E:  Eni SpA (energy)
A:  Agilent Technologies (life sciences and diagnostics)
N:  Unavailable as a single-letter ticker
D:  Dominion Energy (utilities)
E:  Eni SpA (repeated from earlier)
R:  Ryder System (transportation and logistics)
I:   Intelsat (satellite communications)
N: Unavailable as a single-letter ticker
G: Genpact (business process management)
T: AT&T (telecommunications)
O: Realty Income Corp (real estate)
U: Unity Software (technology)
R:  Ryder System (repeated)
The equal-weighted model is up 15% over the past year, while the S&P has been flat. But when Meandering Tour, the Substack, launched three months ago, the portfolio plummeted (a sign?), although not as badly as the S&P, and it has started to come back. As my NXTL history indicates, I would have hung in there.
A fun place to start on GA is the “Featured List,” which includes, among other concoctions:
Degree-Free Leaders: “A collection of companies led by successful executives who either dropped out of college or never attended, demonstrating that formal education isn't always necessary for business success.”
GLP-1 Revolution: “A portfolio focused on companies developing, manufacturing, or otherwise positioned to benefit from the booming market for GLP-1 weight loss and diabetes medications, which are seeing explosive growth and changing healthcare.”
Tariff Shield: “A collection of companies that demonstrate resilience to tariffs and trade disputes due to their domestic focus, supply chain flexibility, pricing power, or ability to pass costs to consumers.”
Dachshund Soirée: “An eccentric blend of companies catering to pampered pups in fashion-forward accessories, premium wine and spirits producers, and cutting-edge biohacking and wellness technology innovators.”
On a more serious note, you can ask GA to replicate longstanding, high-performing mutual funds, like the Fidelity Contrafund (FCNTX), one of the world's largest, actively managed funds that focuses on growth-oriented investments. GA obliged, creating a portfolio that “captures the essence of FCNTX's approach — focusing on companies with strong growth potential that may be undervalued relative to their long-term prospects, often taking positions contrary to prevailing market sentiment.”
Have fun, but please be careful.
Scrupulosity Alert: It’s hard to imagine that anyone would believe otherwise, but nothing in this column is intended to be or should be interpreted as investment advice. (Cue reader mail from Carl.)
1) Closing the Books
I know what you’re thinking (in addition to, Sherman is a sandwich short of a picnic, as the Brits like say): How has SSLTSSF performed since 2016 relative to the S&P 500?
Not well. In short, many of the one-letter legacy companies have languished since then, while the S&P, fueled by the “Magnificent 7” tech stocks, has soared.
I’m heartbroken, but I can take comfort in knowing that I’m not alone in suffering from the disorder known as T3, or Ticker Temptation Trauma. It turns out that several publications have addressed the issue of single-letter preoccupation, but only very recently.
Last year, Seeking Alpha, a crowdsourced financial analysis platform, published an article under the following headline: “Single-letter tickers = single-digit returns?” Sadly, yes.

The year before, Forexezy, apparently an educational site for foreign exchange traders, ran a hard-hitting piece titled “The Power of Tickers: A Lesson in Stock Performance.” Among the findings:
Short and Sweet: One-Letter Tickers
Stocks with one-letter tickers have fared poorly, with an average return of just 2% over the past 12 months. Examples include AT&T, Macy’s (M), and United States Steel (X). These companies, often established and traditional in nature, have struggled to capture the market’s enthusiasm for new technologies.
The Sweet Spot: Four or Five-Letter Tickers
On the other hand, stocks with tickers consisting of four or five letters have experienced significant success. In fact, these tickers have delivered an impressive average return of 25% over the past year.
Who was the prize-winning journalist who wrote this article? “Administrator Forexezy,” according to the byline.
Call me old-fashioned, but I’ll stick with the human beings where I used to work. Long-term, consistent, risk-aware investing, at a reasonable cost.
If you’re interested, on my May 25th Tour, I explored the vocabulary of this phrase from the Sondheim song “I’m Still Here” and an alternate expression using the verb “careen.” Warning: While my analysis was exhaustive, it was also exhausting, as many readers pointed out.
A single basis point is 1/100th of a percentage point, i.e., 0.01%. So, if someone says that interest rates rose by 50 bps, it means that rates increased by 0.50%.
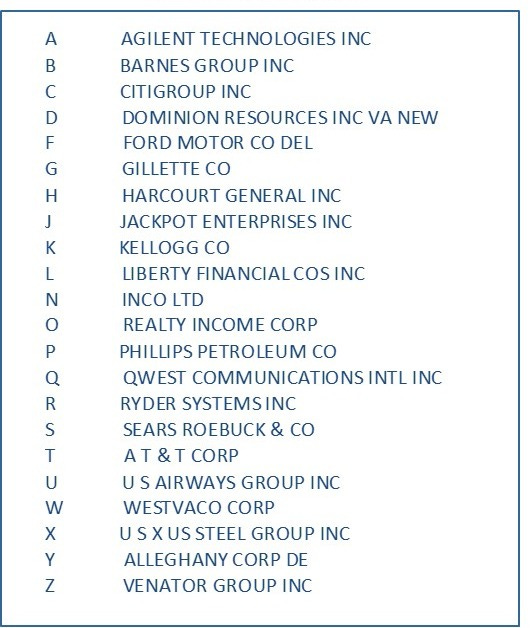
Stocks with one-letter ticker symbols as of 4/30/2000:
For those interested in the model specifications and/or having me committed, here are the details of my request.
I created a hypothetical investment model that began investing in all the stocks that had single-letter ticker symbols (excluding ADRs) as of April 30, 2000.
The model portfolio was equally weighted in all stocks and rebalanced monthly.
If a stock was subsequently de-listed, its assets were re-invested pro-rata across the remaining stocks.
If a new single-letter ticker symbol stock was listed, it was added to the portfolio, with an equal weight invested.
I want to compare (a) monthly forward returns of this model portfolio, using data from the Center for Research in Security Prices (CRSP) to the (b) returns from the S&P 500 for the period from April 30, 2000 to October 31, 2016.

Could you set up a fund based on the Donald’s friends? White House visitors? Mara-Lago visitors/golfers?
Scott how is your fantasy football team doing that includes players with only hyphenated names?